A rope elongation curve is a simple way to show how much a rope stretches as load increases. For aircraft tie-down systems, that matters because rope stretch affects slack, aircraft movement, preload tension, knot tightening, and how the system responds when wind starts loading the airplane.
Most pilots think about rope strength first. Strength is important, but stretch behavior is also important. Two ropes may have similar breaking strengths but behave very differently under the same tie-down load. One may stretch more at low load. Another may feel firmer early but continue stretching more at higher loads. An elongation curve helps make those differences visible.
What the Curve Shows
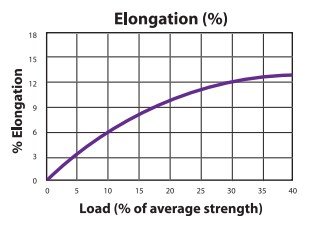
Example curve for illustration only. Actual results vary by rope material, construction, knots, wet condition, age, and loading history.
A typical rope elongation curve has load on one axis and elongation on the other. The horizontal axis usually shows load, often in pounds-force. The vertical axis shows elongation, usually as a percentage of the rope’s original length.
On the chart, the line slopes upward. As load increases, elongation increases. A flatter curve means the rope stretches less for each added pound of load. A steeper curve means the rope stretches more.
Why the Shape Matters
Elongation is not always perfectly linear. A rope may stretch more during its first loading cycle as fibers settle, knots tighten, and constructional stretch is removed. Later cycles may look different after the rope has already been loaded once.
Wet rope may also behave differently than dry rope. Nylon in particular can show different stretch, stiffness, and handling characteristics when wet. That is one reason RampWarden treats wet and dry testing as separate conditions.
Elongation and Aircraft Movement
If a tie-down rope stretches under load, the aircraft may move before the rope reaches higher tension. Some stretch can be helpful because it may make the system less abrupt than a very stiff restraint. But too much stretch can allow more wing movement, more slack recovery, and more change in working length.
For example, assume a wing tie-down rope has an active working length of 100 inches. If that rope elongates 5% under a higher load, that represents about 5 inches of stretch. In a real tie-down system, the total movement seen at the aircraft may also include knot tightening, ring movement, tire compression, and other settling effects.
That is why it is important to separate true rope stretch from total system movement.
Elongation and Preload
Elongation curves also help explain why preload tension should be practical and measurable. A rope with more low-load stretch may feel different than a stiffer rope when pulled by hand. The two-finger method may not reveal the actual tension in the rope.
A portable fish/luggage pull-scale that is used to pull the rope at a known midpoint deflection is more repeatable because it turns “feels snug” into a measurable field check.
Practical Takeaway
An elongation curve does not tell the whole story, but it tells an important part of the story. It shows how rope stretch changes as load increases.
For pilots, the key lesson is simple: rope selection is not only about label strength. Stretch behavior matters too. A good aircraft tie-down setup should consider rope strength, elongation, knots, wet condition, working length, preload, tie-down geometry, and hardware.
The RampWarden Aircraft Tie-Down Rope Calculator helps pilots think through rope length and geometry. Elongation testing helps explain how the rope may behave once load is actually applied.
Key Takeaway
An elongation curve shows how rope stretch increases as load increases. For aircraft tie-downs, that stretch can affect slack, movement, preload, and how predictably the system responds to wind loading.